Understanding COVID-19 Death Data
Eurostat All-Cause Mortality (to Week 35 of 2020) shows that the real risk of COVID-19 remains small, but national economic well-being continues to be most important driver in national death rates.
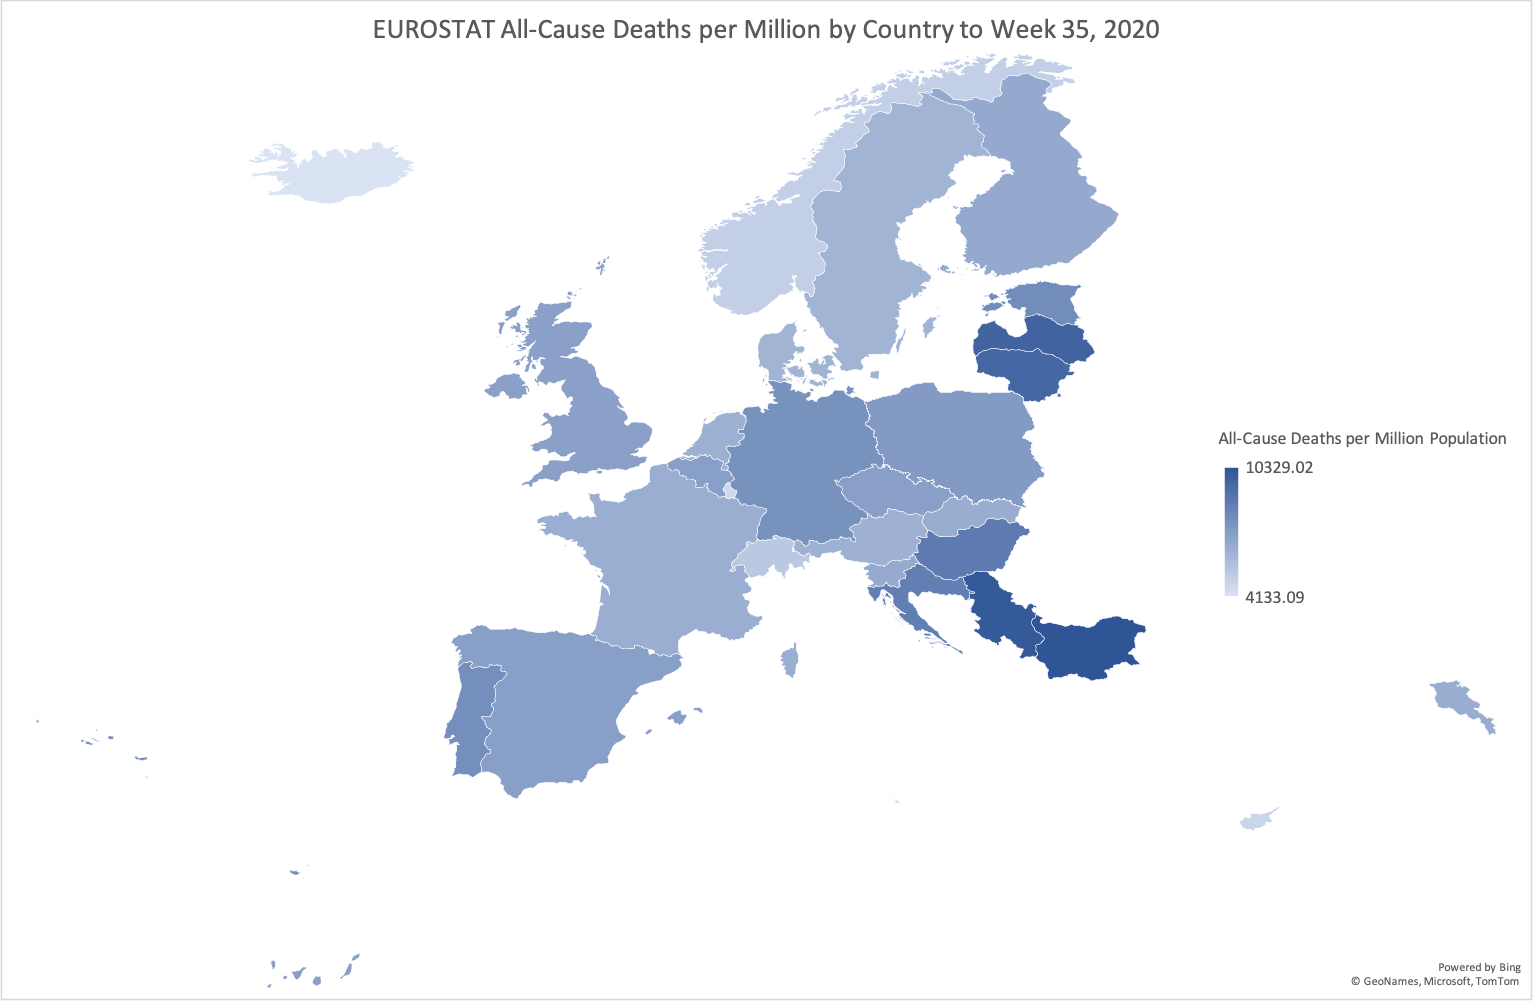
Today, Eurostat have updated their deaths by week & age dataset, their dataset contains the death rates for most European countries to Week 35 (though some countries, like Italy, have yet to report). Using Eurostat population data, it is therefore possible for us to calculate deaths per million to Week 35 of 2020. I have previously shared this data to Week 26 and Week 32 of 2020.
Today, I thought it would be interesting to also show these mortality trends split between COVID deaths and non-COVID deaths. OWID (Our World In Data) via the ECDC (European Centre for Disease Prevention and Control) make public COVID-19 death rates across Europe, as reported by local authorities. We can use the OWID data from the 30th August 2020 (end of Week 35) to help our understanding.
In the chart below, you will see non-COVID deaths as black bar charts and the deaths reported as being from COVID in red.
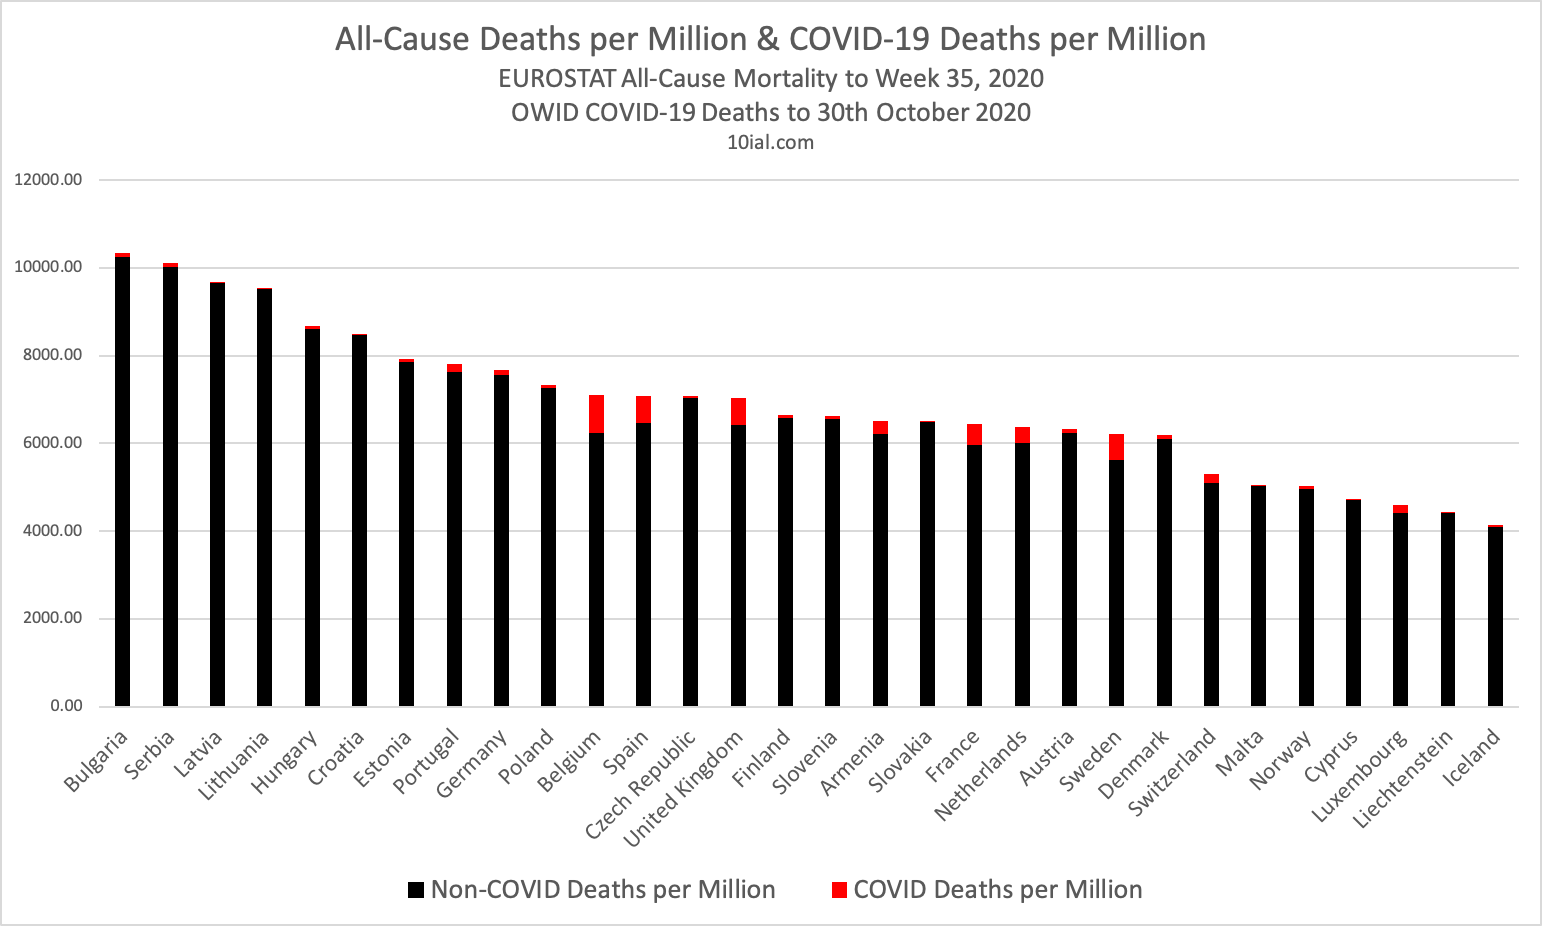
This chart re-iterates a number of key points:
- Eastern European countries (e.g. Bulgaria, Serbia & Latvia) maintain the highest death rates in Europe whilst higher-income small countries maintain the lowest death rates (Iceland, Lichtenstein & Luxembourg). This shows that strong national economies remain the key component in having strong healthcare systems.
- Portugal and Germany are often praised for their response to the pandemic, but they still have a higher all-cause death rate than countries like Belgium, Spain and the United Kingdom.
- Even amongst countries reporting a considerable number of COVID-19 deaths, COVID-19 still represents a small fraction of deaths - I make no claim however as to why this is and Randomised Control Trial evidence is needed to actually understand the merits of any interventions.
It is important to re-iterate that the metrics used here are All-Cause Mortality data, the most comprehensive measure of death data of a nation - but I have provided some additional commentary below on additional metrics.
On Attribution of Deaths
It is also interesting to note that there is a negative trend between the 2020 All-Cause Mortality rate and the % of 2020 Deaths from COVID-19. As the death rate in a given country increases, the likelihood of a death being reported as a COVID-19 death goes down. For example, to Week 35 of 2020; Sweden has reported 6204.64 deaths per million with 9.3% as being from COVID-19 whilst Bulgaria has seen 10329.02 deaths per million but only 0.84% as being from COVID-19.
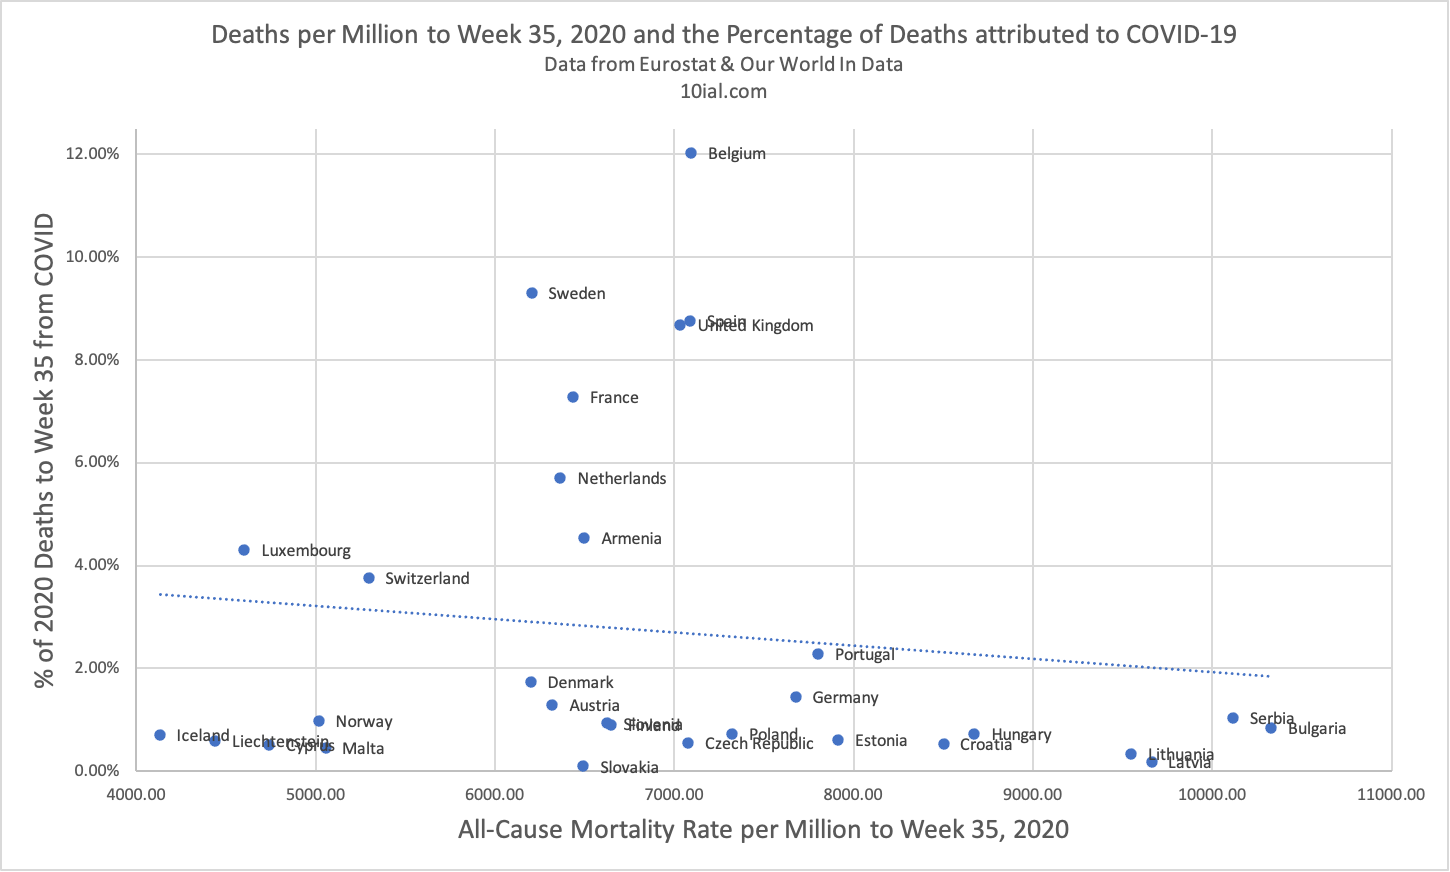
It is well known that COVID-19 death reporting practices differ greatly region-to-region, let alone country-to-country, so I won't reiterate such points here.
"Excess Deaths" vs All-Cause Mortality
Finally; I have previously written about why All-Cause Mortality (adjusted for population) is the best metric for measuring deaths during a pandemic. This view is also held by the UK's Chief Medical Officer before the pandemic took root, but I wanted to provide some visualisation of this.
Below I have plotted the All-Cause Mortality rate to Week 25 of 2020 (as orange bars) against the complete 5-year average of death data from Eurostat (as the blue lines). The part of the bar chart that is visible above the blue line crudely indicates the extent of any excess mortality.
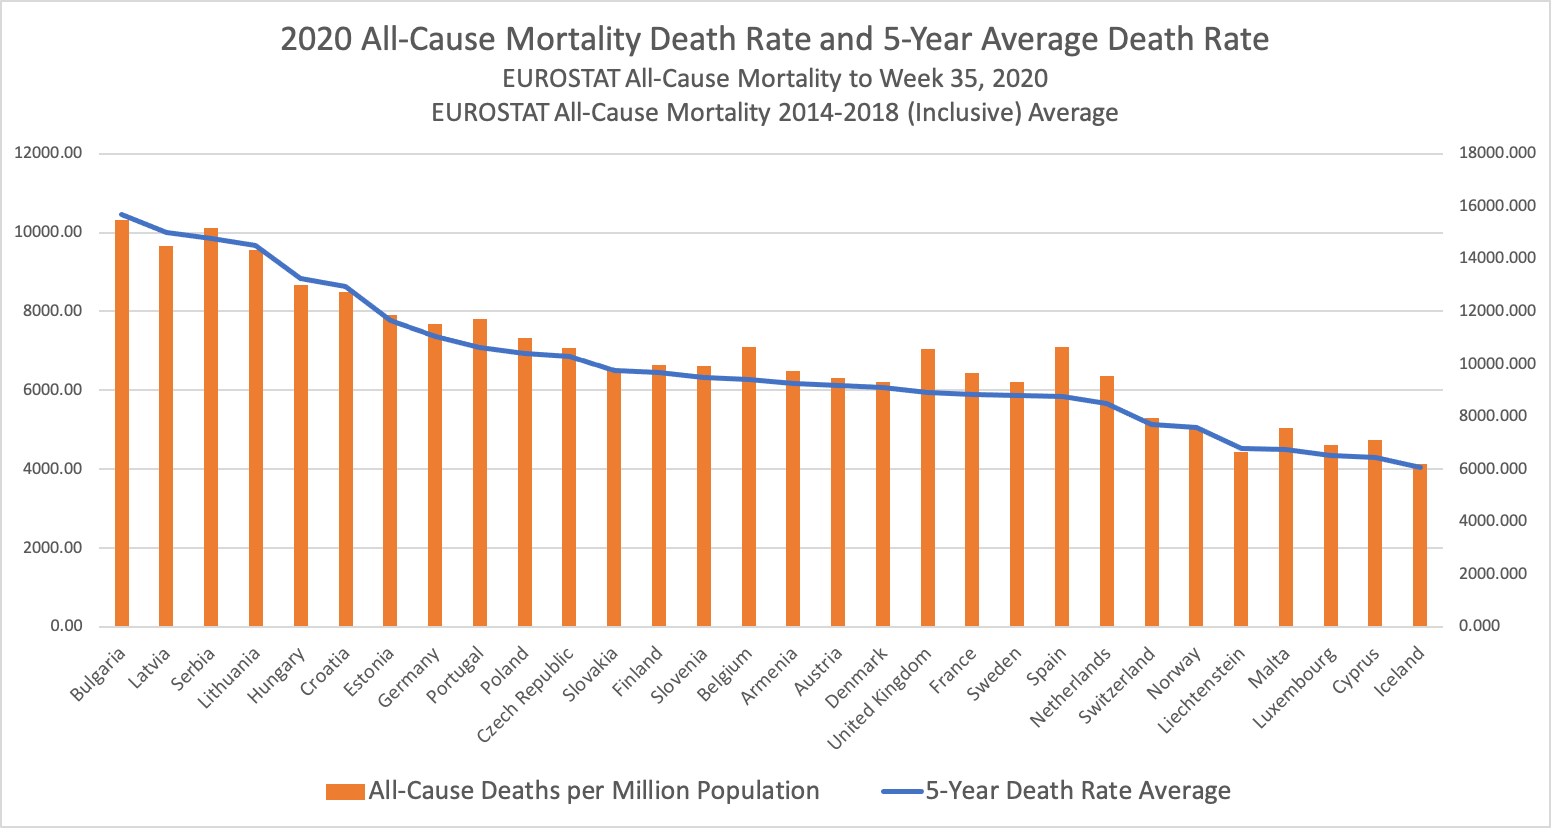
Due to differences in approaches to measurement, we know COVID-19 deaths is a poor metric for international comparisons so some have turned to using "Excess Mortality" metrics which are even worse. "Excess Mortality" is where a country compares their own performance that year to a 5-year average, this metric is then used for an international comparison.
Countries which achieve low average mortality rates can often be at risk of having high "Excess Mortality" rates as they have more vulnerable members of the population and it becomes costlier to introduce measures that lead to reductions in mortality rates year-over-year. Countries with less developed healthcare systems are able to introduce low-cost measures to reduce mortality rates year-over-year whilst countries with more developed healthcare systems must invest more for the same benefit.
A prime example of this the United Kingdom and Germany. To Week 35, Germany had a death rate over 9% higher per head of population. Germany has both higher 5-year average death rates and 2020 death rates than the UK. Despite the UK having a universal free-at-the-point-of-use National Health Service which was capable of finding the first and only known life-saving COVID-19 drug, the UK had a higher "Excess Mortality" rate precisely because of the success of the healthcare system in previous years.
It is also critical to remember the mortality displacement phenomena; following a pandemic, as there are less vulnerable members of the population, deaths rates will grow less fast.
All-Cause Mortality represents the real risk to death within the population of a nation, the metric that matters most and precisely the metric a healthcare system exists to reduce.